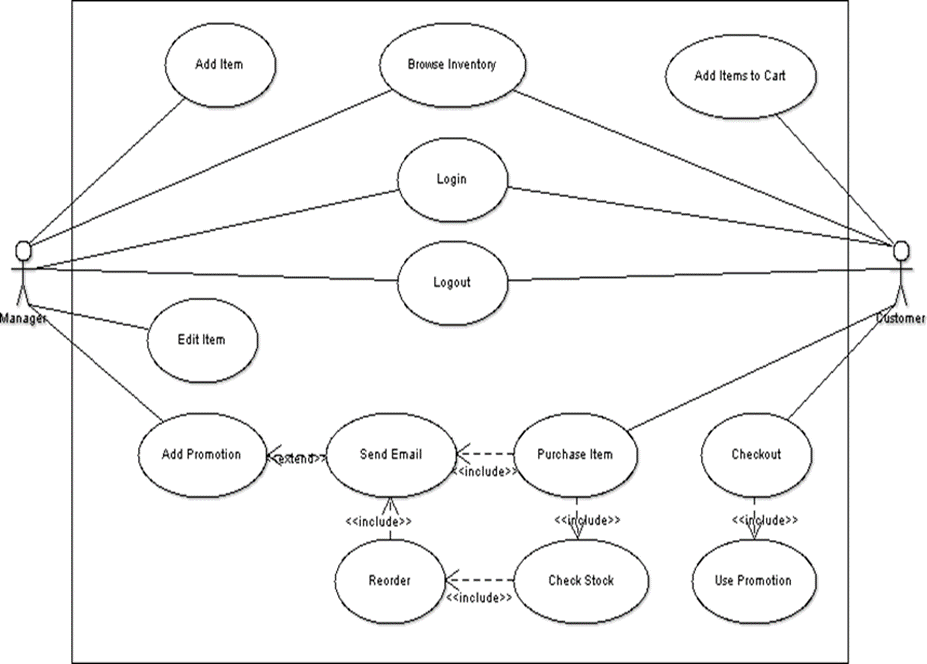
Use cases are basically designed to explain which things will be interacting with the system. It will also explain the different functionalities graphically. Given below is the different terms of use case diagram that will help understand the diagram to the reader of this document.
| Actors | These are the objects that will directly interact with the system. These are the sticks given in the diagram with a name underneath them. |
| Use Cases | These are used to show the functions of the system that are must to be implemented. These are oval shapes in the diagram. |
| Interactions | These are the lines that show the direct connection between actor and the use cases. |
| Includes | This shows that a use case uses the functionality of another use case. This is shown with dotted line and written on it includes. |
| Extends | This shows that a use case uses all of the other use cases functionality and adds extra functionality as well. This is also shown with dotted line but written on it is extends. |
| The System Boundary | This shows the boundary of the system. Everything that is within this is included in the system. And system will be responsible for everything included in it. It is shown with a large rectangle. |
| Use Case Template | This is used to explain the basic functionality and uses of the use case diagram. |
| Type | This is used to show if a use case is directly interacted with the actor or not. |
| Cross Ref | It is a field in the use case diagram which describes that which requirement satisfies the specific use case. |
| Use-Cases | It is a field in the use case template that explains that which use case must be executed before executing the specific use case. |
3.3.1 System Use Case
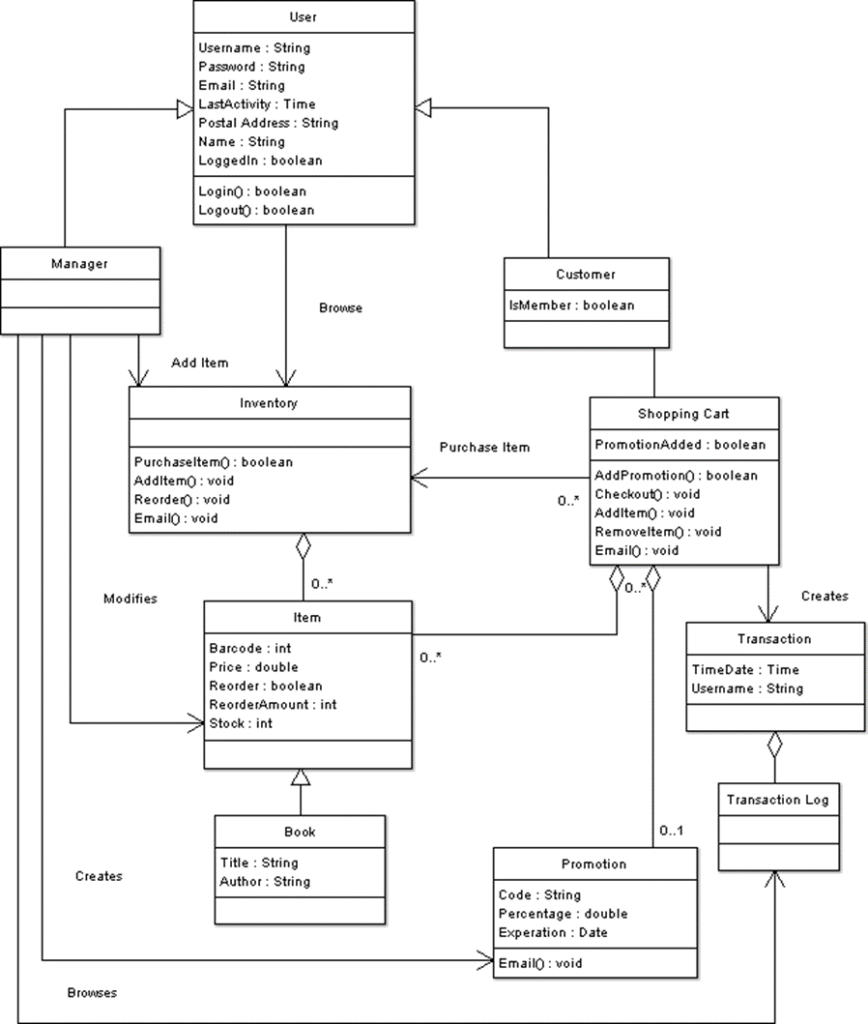
Class Diagram
Class diagram is used to show the communication between objects of the system in order to achieve the functionality of use cases. Below is the description of some of the class diagram terms and keywords.
| Class | Classes are represents by the use of rectangles. These rectangles are split into three parts. One for the name of class, second for the variables of the class and third is used to write the names of functions of class. |
| Variable | Variables names are represented by the text followed by the semi colon. Their data type is also written on the end which shows which type of data can be stored in the variable. |
| Function | Functions names are represented by the text followed by the parenthesis. There will also be variable names in the parenthesis to show how much data will be sent to the functions. |
| Generalization | Generalizations are represented by the a line with an unfilled triangle at the end of the line. |
| Aggregations | Aggregations are represented by the lines with unfilled diamond at the end of line. Aggregation means that the object with the diamond is in possession of other objects with no diamond. |
| Associations | Associations are represented by the lines which connects two classes. These lines show that there is some relationship between the two connected classes |
| Multiplication | These are the numbers on the end of every association and aggregation. These numbers show that how many objects are connected to one another |
There are so many requirements for this software system but we will discuss some of them which are most important for online cloth store.
• Effectiveness
• Performance
• Reliability
• Quality
• Easy to use
• Availability
• Security
3.6 Inverse Requirements
There are not any inverse requirements for this software system.
3.7Logical Database Requirements
In this section, requirement related to the database is described. It will be described that how many tables are needed and what attributes will be there for any table. So, in the E-Commerce system, total tables will be five. Details of the table are given below.
1. Table admin
a. ID
b. Name
c. Contact
d. Email
e. Password
f. Last activity
2. Tamers
a. ID
b. Name
c. Contact
d. Address
e. Email
f. Password
g. Last activity
3. Table brands
a. ID
b. Name
c. Enabled
4. Table products
a. ID
b. Name
c. Price
d. Brand id
e. Quantity
f. Color
g. Enabled
5. Table orders
a. ID
b. Customer id
c. Total bill
d. Items
3.8Design Constraints
In this section, design limitations are being discussed based on the hardware provided for the system. In order to run the system, user must have the computer with an OS installed in it. A browser must also be available in the system. A working internet connection is also necessary for the system to run as the system is based on the web. So, without an internet cone
System is unable to run.
4. Analysis Models
This section describes the analysis of the project in the real world. Analysis of the project is done by using different diagrams of software engineering. These diagrams show different angle of the project so that the designer of this project easily understands the requirements of this project and implement them in an easy way.
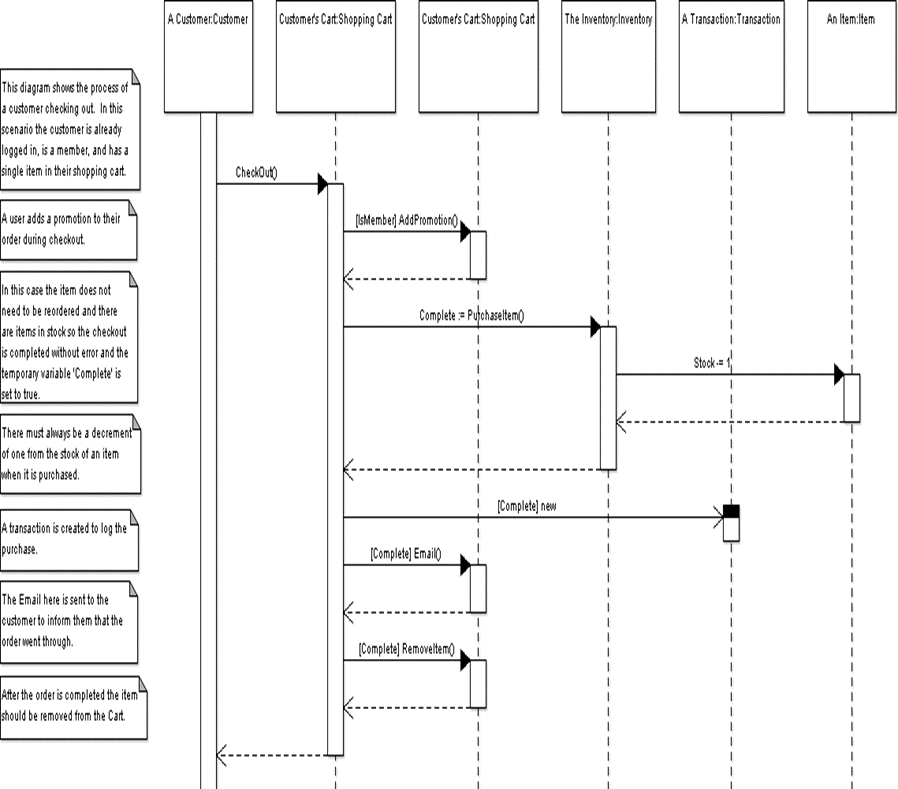
4.1 Sequence Diagrams
As the name indicates, sequence diagram describes or explains different sequences of different tasks in the system. For the purpose of this diagram, it uses class diagram to show different things in the system. Purpose of this diagram is to ensure that the system is running and working in the proper way and nothing will go wrong at the time of executing.
Below are some terms which will be used in the diagram
| Axis | The x-axis shows movement among different things and the y-axis shows time. |
| Comments | Comments are used to explain what is going on the specific time or stage. These are written on the left side of the diagram |
| Instance | These are the solid boxes on the top of the diagram with dotted lines. Instances are of some specific objects. The first part of the text shown in the box is the name of the instance and the name of the object is followed by it. |
| Call | These are the lines with the triangle at the end of each line. These are used to show the movement or transition of one instance to another. There may be a label on the top of each line, which represents a function call or a variable set. |
| Variable set | This is shown by “+=”, “-=” etc. these show that a value of one variable is assigned to the other |
| := | This symbol means that the variable is being set directly |
| += | This symbol means that the value of the variable is being added |
| -= | This symbol means that the value of the variable is being subtracted |
| Guard statement | Guard statement is used to set some kind of criteria on any function |
| Returns | These are used to show the return value of the function. Dotted line with an arrow on the edge is used to show returns. |
| Object execution time | The object execution time describes the time of execution of any object in the diagram. |
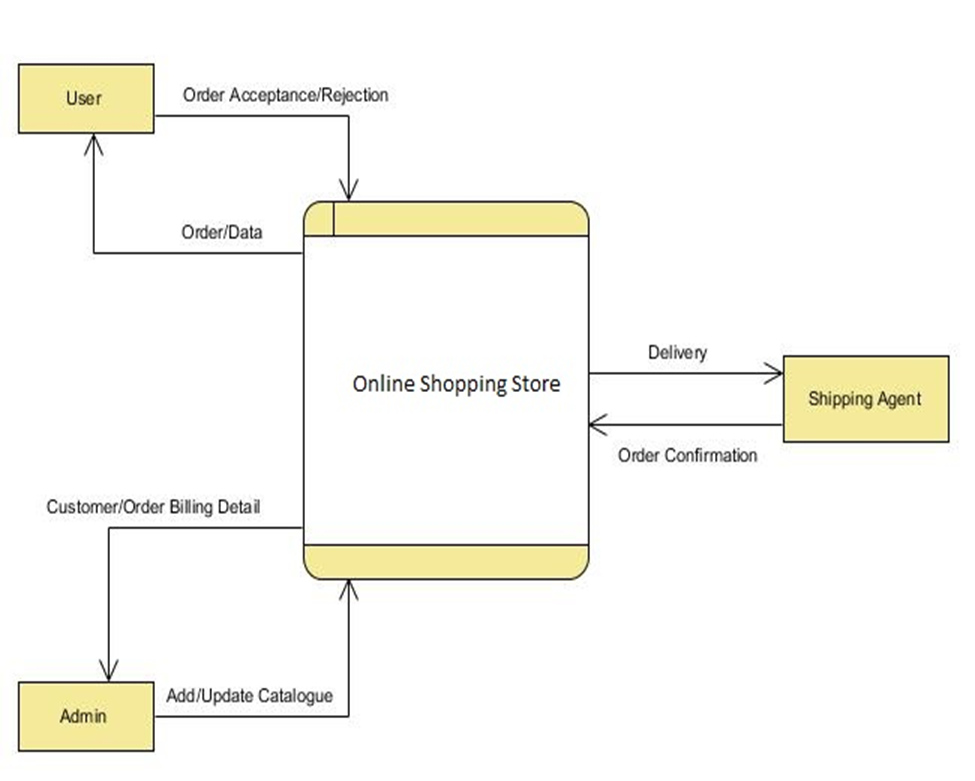
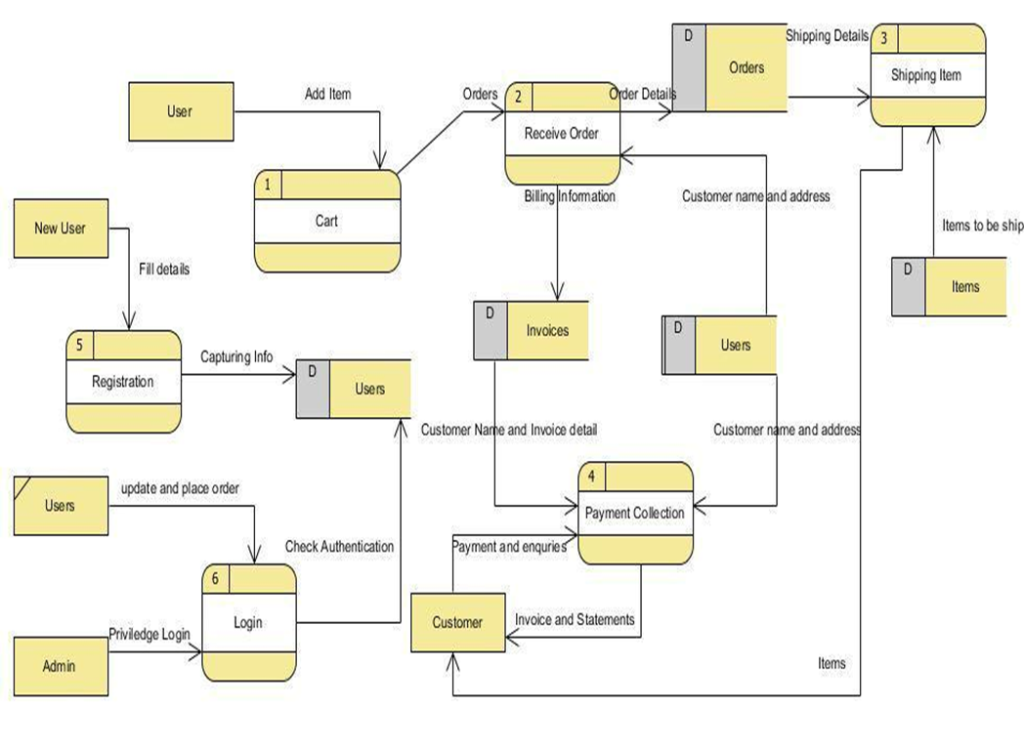
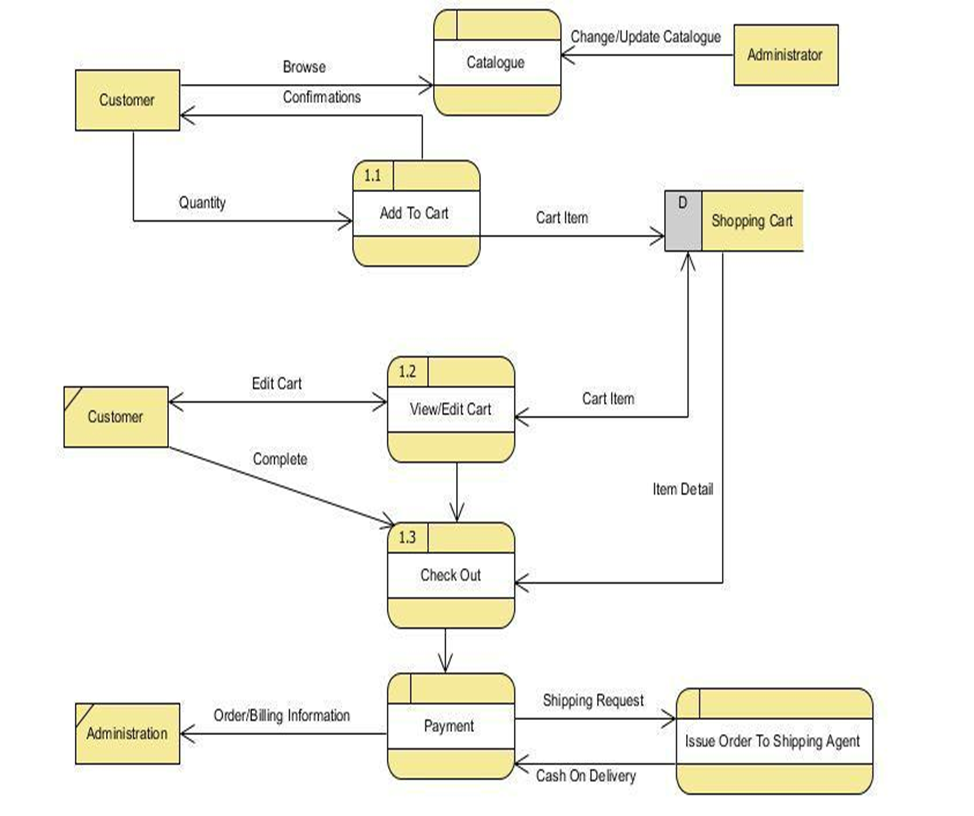
2 Data Flow Diagrams (DFD)
There are many levels for the data flow diagram. These levels indicates different functions of the system with different aspects
Context Diagram
Level 1
Level 2
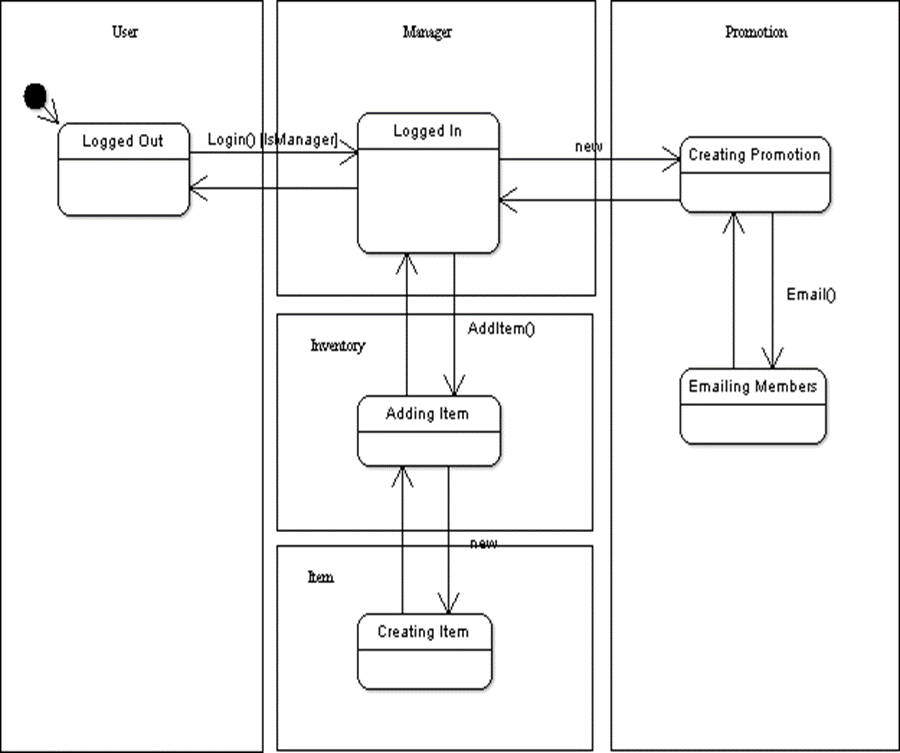
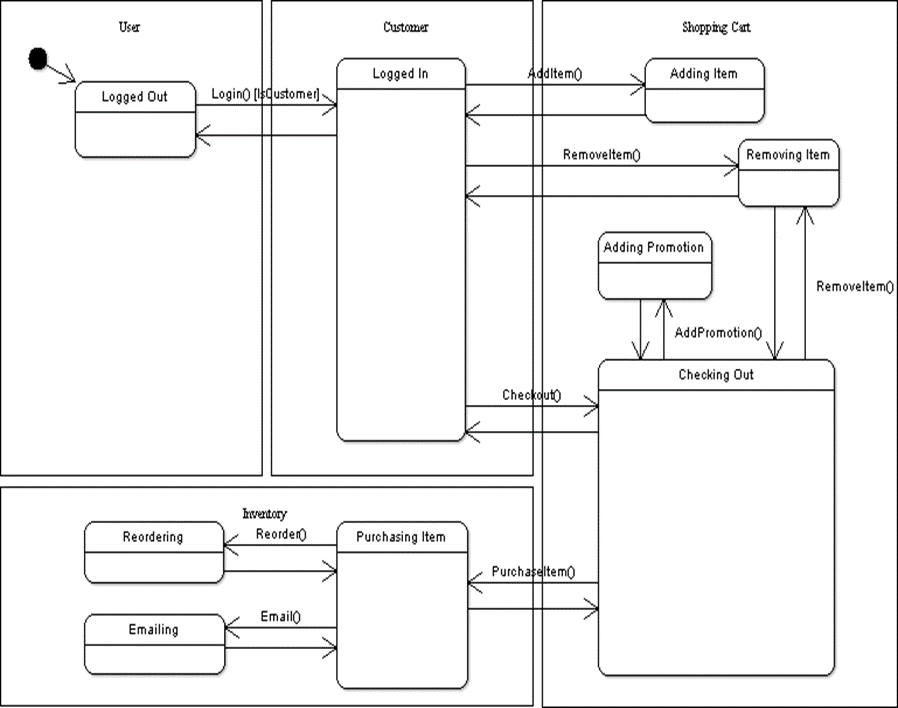
4.3 State-Transition Diagrams (STD)
The state diagram uses all the other diagrams to display the necessary changes in the system and display the working of the system
| Starting point | This is the place which represents the starting stage of the system. There may be a line with an arrow which guides to the starting point. |
| States | States are shown with the use of rectangles with the rounded edges. These are split in to two parts. Half has the name of the state. And the other half contains the further attributes of the state. |
| Transitions | The transitions are the arrows which are used to show the movement of the state from one state to another state in the system. |
| Objects | These are the classes of the system. They can contain many states and transitions. These are shown with the use of bigger boxes. |